Analysis
To perform analysis on the inputs, click on the compute menu and select the compute menu item. This will perform the analysis on the input parameters. If there are errors the will be notifications regarding the same. The results will be available in the analysis pane. For more details refer to the compute menu section.
Analysis Pane
Results of analysis for “discrete spring model” & “elastic half-space model” are shown in two separate panes.
These get populated once the compute menu is clicked. Depending the analysis selected in the project properties pane, the appropriate analysis pane will contain the results if the execution is successful. The Analysis tile will appear green after successful computation.
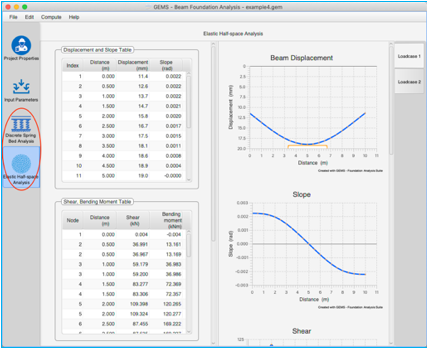
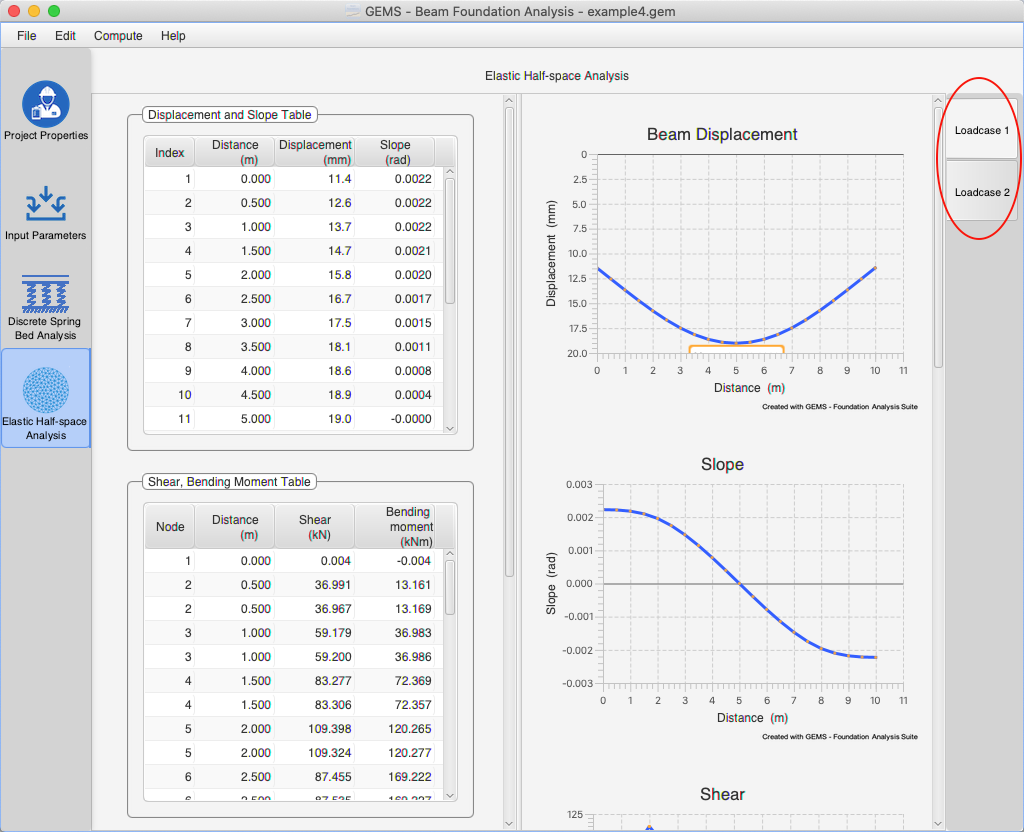
Load Case analysis tabs
Each analysis pane consists of multiple load case tabs displaying the analysis for the corresponding load cases.
Each load case analysis tab consists of three tables and six graphs
2. Shear, Bending moments Table
1. Displacement
2. Slope
3. Shear
Analysis tables
Each load case analysis tab consists of tables tabulating the analysis results for the load case.
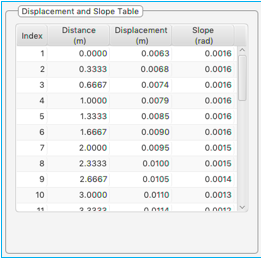
Displacement & Slope Table
The Displacement & slope table contains the vertical displacement & slope of the beam along the length of the beam. Each point represents a node in the finite element analysis. Downward displacement is considered positive.
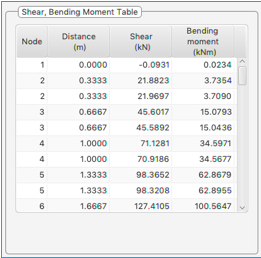
Shear, Bending moment Table
The Shear, Bending moment table contains the Shear forces & Bending moment experienced by the beam. Each point represents a node in the finite element analysis.
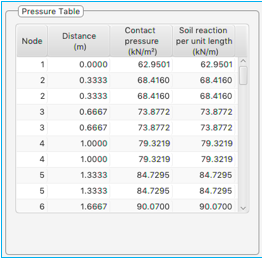
Pressure Table
The Pressure table contains the Contact pressure & Soil reaction per unit length experienced by the beam. Soil reaction is the pressure divided by the breadth of the beam. In the example below, since the width of the beam is 1m, the contact pressure & soil reaction values are same. Each point represents a node in the finite element analysis.
Analysis Graphs
Analysis graphs plots the contents of the analysis tables. The contents of the graph can be copied by right clicking on the graph and selecting ‘copy’ from the context menu. For cloud version, the graph can be saved as a 'png' image by right clicking on the graph and selecting ‘save' from the context menu
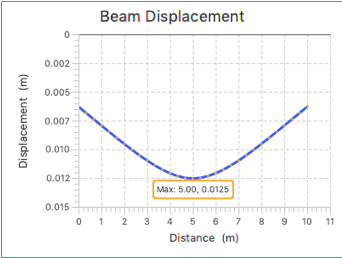
Beam Displacement Graph
Beam Displacement graph plots the vertical displacement along the length of the beam. Downward displacement is considered positive. The graph plots the ‘displacement’ column of the ‘displacement and slope table’ vs ‘distance’ column. The maximum displacement and the point at which it occurs is highlighted in the graph.
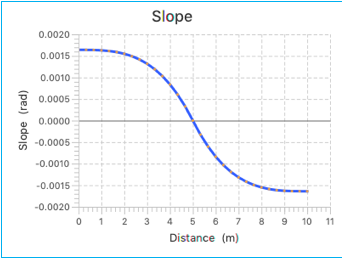
Slope Graph
Slope graph plots the slope of the beam vs length of the beam. Downward displacement is considered positive. The graph plots the ‘slope’ column of the ‘displacement and slope table’ vs ‘distance’ column.
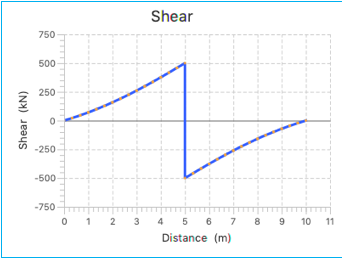
Shear Graph
Shear graph plots the shear forces along the length of the beam. The graph plots the ‘shear’ column of the ‘shear and bending moment’ table vs ‘distance’ column.
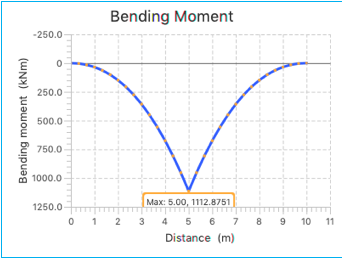
Bending Moment Graph
Slope graph plots the shear forces along the length of the beam. The graph plots the ‘
Bending moment’ column of the ‘shear and bending moment’ table vs ‘distance’ column. The maximum bending moment and the point at which it occurs is also highlighted in the graph.
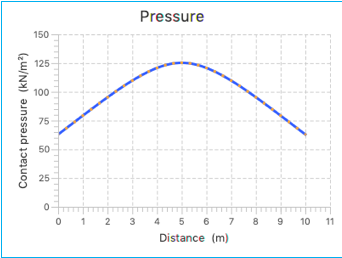
Contact Pressure Graph
Contact pressure graph plots the contact pressure along the length of the beam. The graph plots the ‘contact pressure’ column of the ‘Pressure’ table vs ‘distance’ column.
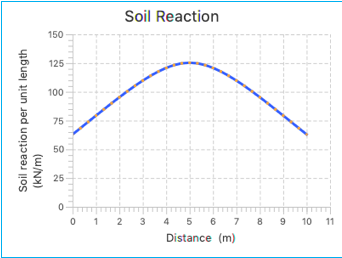
Soil Reaction Graph
Soil reaction plots the ‘soil reaction per unit length’ experienced along the length of the beam. The graph plots the ‘soil reaction per unit length’ column of the ‘Pressure’ table vs ‘distance’ column.